OpenPharmaStability report
Stability analysis
ICH Q1E inspired decision support for assay
at 25C/60RH. The Python engine owns the model,
confidence bound, crossing estimate, reproducibility metadata, and artifact record.
Supported shelf life
17 months
Statistical crossing 18.0 months. Rounded down to a whole month.
Decision Summary
The headline decision is the earliest supported period implied by the selected model and one sided confidence bound. Internal ids are retained in badges for audit traceability.
Supported shelf life
17 months
Statistical crossing
18.0 months
Observed data
24.0 months
Governing batch
B2
Model selected
Common slope, batch-specific intercepts
Poolability alpha
0.25
Confidence bound
Lower one-sided 95% confidence bound on the mean response
Extrapolation
No. Supported period is within observed data.
Dataset
| Attribute | assay |
|---|---|
| Unit | not recorded |
| Condition | 25C/60RH |
| Direction | decreasing |
| Number of batches | Not recorded in metadata |
| Time points (months) | Not recorded in metadata |
| Row count used in fit | 42 |
| Required-column validation | All required columns present (assumed) |
Model
| Model kind | Common slope, batch-specific intercepts common_slope_batch_intercepts |
|---|---|
| Model formula | value ~ time + batch (common slope, batch-specific intercepts) |
| Estimated parameters |
b0_B199.8623b0_B298.9486b0_B3100.802b1-0.488847 |
| Residual df | 38 |
| Residual standard error (s) | 0.331206 |
| Batches in fit |
B1, B2, B3
|
Poolability
| Decision | Partial pooling (common slope, batch-specific intercepts) partial |
|---|---|
| Alpha (significance level) | 0.25 (ICH Q1E reference alpha = 0.25) |
| Guidance profile | Q1A_R2+Q1E |
| Step 1 p-value for slopes |
0.9056
≥ alpha, proceed to intercept test
|
| Step 2 p-value for intercepts |
1.658e-16
< alpha, intercepts differ, common slope
|
| Poolability notes |
|
Shelf Life Estimate
| Supported shelf life | 17 months |
|---|---|
| Statistical crossing (months) | 18.0 |
| Observed long-term data (months) | 24.0 |
| Confidence bound used | Lower one-sided 95% confidence bound on the mean response lower_one_sided_95_mean (level = 0.95) |
| Crossing status | Crossed specification within the evaluated horizon crossed |
| Governing batch | B2 |
| Extrapolation | No. Supported period is within observed data. |
The supported shelf life is rounded down to the nearest whole month, per ICH Q1E.
Confidence Bound Plot
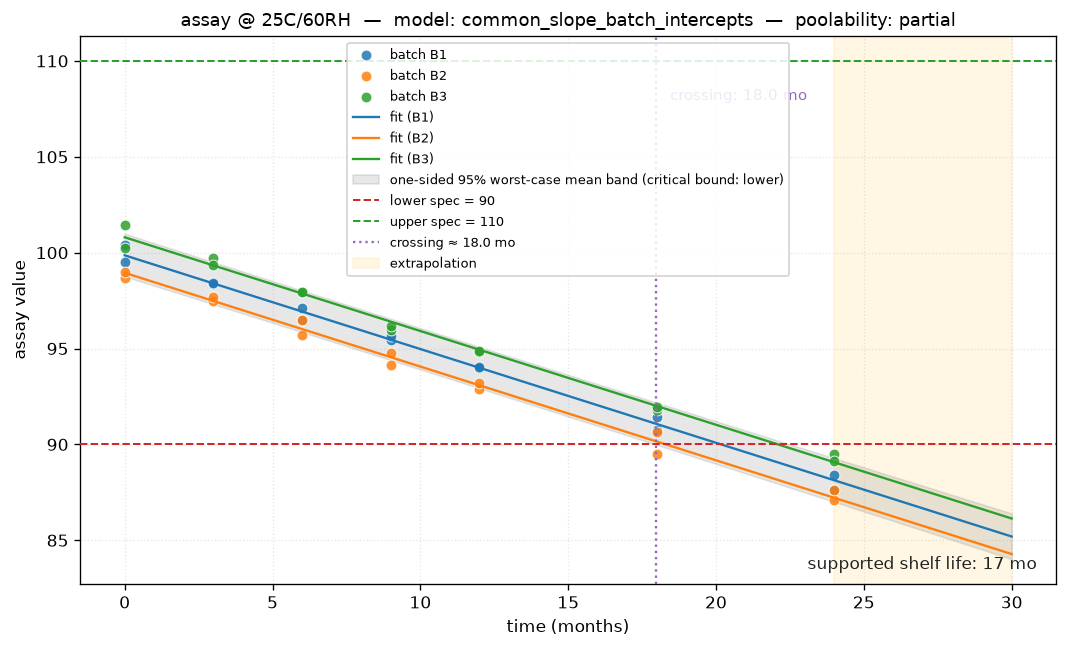
Observed data by batch, fitted regression, the
lower one-sided 95% confidence bound on the mean response, and the relevant
specification limit. Crossing point and extrapolation region
are marked. Plot file:
confidence_plot.png.
Diagnostics and Assumptions
Linearity: ok
Homoscedasticity: ok
Normality of residuals: ok
Influential points (Cook's d): 4
Diagnostic notes
- Influence check: 4 observation(s) have Cook's distance > 4.0/n = 0.0952 (row indices [13, 24, 28, 29]). A single observation controls the fit. Consider a sensitivity analysis with and without these points; do not auto-exclude.
Warnings and Limitations
- data_quality[info] duplicate_batch_time_no_replicate: 42 rows share (batch, time, attribute) ; no 'replicate' column
- data_quality summary: 0 error(s), 0 warning(s), 1 info; can_analyze=True
- step1 slopes: F-test on time:C(batch), p=0.9056 (alpha=0.25)
- step2 intercepts: F-test on C(batch), p=1.658e-16 (alpha=0.25)
- Influence check: 4 observation(s) have Cook's distance > 4.0/n = 0.0952 (row indices [13, 24, 28, 29]). A single observation controls the fit. Consider a sensitivity analysis with and without these points; do not auto-exclude.
Significant-change assessment (ICH Q1A)
| Accelerated condition | not recorded |
|---|---|
| Intermediate condition | not recorded |
| Extrapolation allowed | yes |
| Rationale | no accelerated data |
Criteria fired
| Criterion | First change (months) | Evidence |
|---|---|---|
| accelerated | not recorded | |
| intermediate | not recorded |
Model effects
| Model | fixed
(Q1E default fixed effect batch)
|
|---|
Reproducibility
| Tool version | 1.0.3 |
|---|---|
| Analysis timestamp (ISO-8601) | 2024-06-01T00:00:00Z |
| Input file SHA-256 |
65138b8343548cfcc775d822e124c556ed47e62fdec455bc4ccd7d946f8a497e
|
| Random seed (if any) | none / deterministic core |
| Library versions |
python3.12.10pandas3.0.3numpy2.4.6scipy1.17.1statsmodels0.14.6matplotlib3.11.0jinja23.1.6 |
Disclaimer. This report is ICH Q1E-inspired and intended for educational, exploratory, and reproducible decision-support use. It is not a substitute for qualified regulatory, statistical, or quality review. The toolkit does not provide 21 CFR Part 11 audit trails, electronic signatures, or data integrity controls, and is not a validated GxP system.